 It didn’t take long after the journal Nature put online the article on the banana genome sequence for bloggers to start commenting on the Venn diagram featuring a a bright yellow banana. David Ng at Popperfont qualified it as, “quite possibly the most complicated (and therefore awesome) Venn Diagram ever”. Jonathan Eisen, the scientist who coined the term phylogenomics, said that it was “perhaps the best genomics Venn diagram ever”, while Joe, of the It’s okay to be smart blog wrote that it is “a pretty genius way of delivering a bunch of banana data all at once”. He added that it was the first time he ever saw a six-way Venn diagram. Joe is right to be impressed, but the truth is that this is not the first ever six-way Venn diagram.
 As a graphic designer correctly noted, the diagram was inspired by Edward's six-set Venn diagram. I can confirm this because the bioinformatics scientist who did the number crunching and the Venn diagram for the Nature article is a Bioversity colleague.
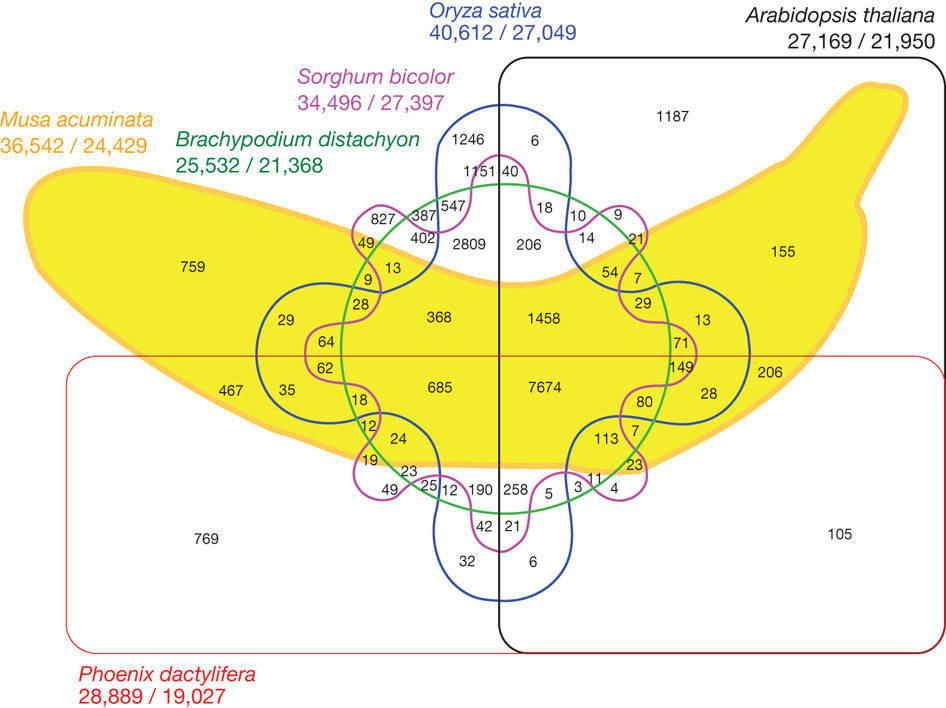
It says a lot about the banana that its distinct shape would make people notice an otherwise arcane diagram. Some people, however, mistakingly thought that the numbers in the Venn diagram represent the number of genes the banana shares with four other monocot species (rice, sorghum, Brachypodium – a wild grass, date palm) and one dicot species (thale cress, better known in scientific circles as Arabidopsis). Monocots and dicots are two major groups of flowering plants distinguished by their number of embryonic leaves (cotyledons).
The numbers in the intersections actually represent shared gene families. A gene family is a cluster of genes that code for similar proteins, i.e. they are above a set similarity treshold (when comparing distant species some scientists prefer looking at the proteins rather than at the DNA sequences that encode them). What the diagram says is that over time the 7,674 gene clusters shared by the six species did not change much in these lineages, as opposed to the 759 clusters specific to the banana (Musa acuminata), for example. Although the genes in these clusters probably share common ancestors with other species, they have since changed to the point that they haven taken on new functions.
Gene families are useful to predict the function of genes based on their similarity with genes of known function. An example of their application in comparative genomics is the GreenPhyl website, which has recently been updated with the banana genome. The homepage has also been redone so that each time a new genome is added, the species tree is automatically expanded.
If you are interested in the sequencing of the banana genome, you can go to First glimpse at the banana genome.